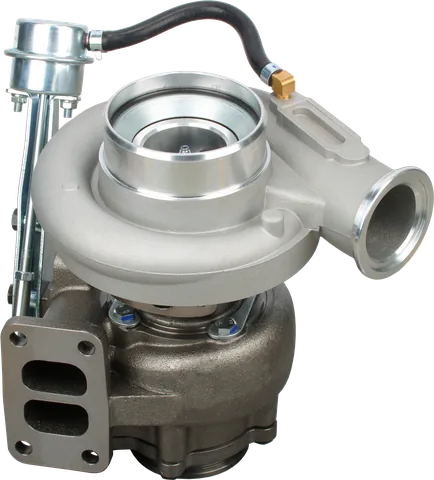
For an upgrade buyer learning how to read a turbocharger compressor map, the useful question is whether the compressor suits the engine from the intended boost threshold to maximum operating speed. One attractive peak-power point cannot answer that.
For a mechanic replacing a stock turbocharger, application matching usually matters more than comparing maps. Start with how to verify turbo fitment before ordering, then use map analysis when modifications change the engine’s requirements.
The turbo compressor map: Airflow Across, Pressure Ratio Up
Most automotive compressor maps place corrected mass flow on the horizontal axis and compressor pressure ratio on the vertical axis. Check the labels: units and correction conventions vary.
| Map feature | What it describes | Practical use |
|---|---|---|
| Horizontal axis | Usually corrected mass airflow, in lb/min or kg/s | Compare engine air demand with compressor capacity |
| Vertical axis | Absolute outlet pressure divided by absolute inlet pressure | Account for boost and system pressure losses |
| Efficiency islands | Contours of equal compressor efficiency | Assess heating and compressor power demand |
| Speed lines | Constant shaft speed or corrected speed | Check operating speed and available margin |
| Surge line | Low-flow stability boundary | Avoid demanding excessive pressure at insufficient flow |
| Choke region | High-flow end of useful compressor operation | Identify limited capacity and declining performance |
Mass flow means the amount of air passing through per unit time. It differs from volume flow: a cubic foot of hot, thin air contains less mass than a cubic foot of cool, dense air.
Why the Airflow Is “Corrected”
A compressor behaves differently as inlet temperature and pressure change. Corrected air flow puts those inlet conditions on a reference basis so your operating point can be compared with the published map.
A common turbocharger corrected airflow calculation is:
Corrected mass flow = actual mass flow × √(inlet temperature ÷ reference temperature) ÷ (inlet pressure ÷ reference pressure)
Temperatures must be absolute, normally kelvin, and pressures must be absolute. Use the map publisher’s reference values; do not assume every manufacturer uses the same ones.
Corrected flow is a plotting value. It does not mean the engine physically consumes extra air because you applied a correction.
Turbocharger Pressure Ratio vs Boost: Use Absolute Pressure
The basic calculation is:
Pressure ratio = absolute compressor outlet pressure ÷ absolute compressor inlet pressure
A boost gauge typically reads pressure above local atmosphere. Its reading alone cannot supply either side of that calculation.
The compressor inlet may be below atmospheric pressure because of the filter and intake plumbing. Its outlet must be above intake manifold pressure to overcome intercooler and charge-pipe losses.
Published maps commonly use total pressures. Shop measurements from static pressure taps provide an estimate; precise matching requires measurement locations and pressure definitions consistent with the map.
Efficiency Islands: Why Their Location Matters
A turbo efficiency island is a contour enclosing operating points with similar compressor efficiency. The most efficient area generally lies inside surrounding, lower-efficiency contours.
An efficiency label describes how closely compression approaches an ideal process. It does not mean that percentage of the air reaches the engine or that the same percentage of engine power is retained.
At the same inlet temperature and pressure ratio, a less efficient compressor produces hotter outlet air and requires more shaft power for a given mass flow. That means:
- More heat for the intercooler to remove.
- Potentially higher intake manifold temperature.
- Greater turbine power demand.
- Less thermal headroom during sustained load.
Compression heats air even at high efficiency. The aim is to avoid unnecessary heating across the operating range that matters to the vehicle.
For a truck that spends time pulling under load, examine those sustained operating points on a diesel turbocharger compressor map. A brief visit to the best island near maximum rpm is not enough.
Speed Lines, Surge and Choke
Speed lines connect points at the same compressor rotational speed. Some maps show actual shaft rpm; others use corrected speed. Read the legend before comparing them with a shaft-speed limit.
These lines are unrelated to engine rpm in any fixed ratio. A turbo’s speed depends on the balance between turbine power and compressor demand. See how fast a turbo spins for more detail.
Do not extrapolate past published speed limits because an uncharted area appears close to a plotted line.
The Surge Line
The left boundary typically marks the surge limit. Near it, the compressor is trying to maintain pressure while passing relatively little air. Beyond the stable range, pressure and flow can oscillate, with flow reversal possible.
An oversized compressor paired with aggressive low-rpm boost demand can place an engine’s operating point too close to this boundary. Throttle closure creates a different transient condition that steady operating points do not fully describe.
Leave appropriate margin rather than placing a target directly on the line. Housing configuration and installation conditions matter, so there is no universal margin suitable for every map. Our guide to compressor surge and turbo flutter explains the symptoms and operating conditions.
The Choke Region
At the high-flow side, increasing speed eventually produces little additional useful flow. Local flow passages can reach sonic conditions, while efficiency and pressure capability deteriorate.
The map’s right edge is not necessarily one precisely marked choke line. Treat the published boundaries as limits to investigate, not targets to exceed.
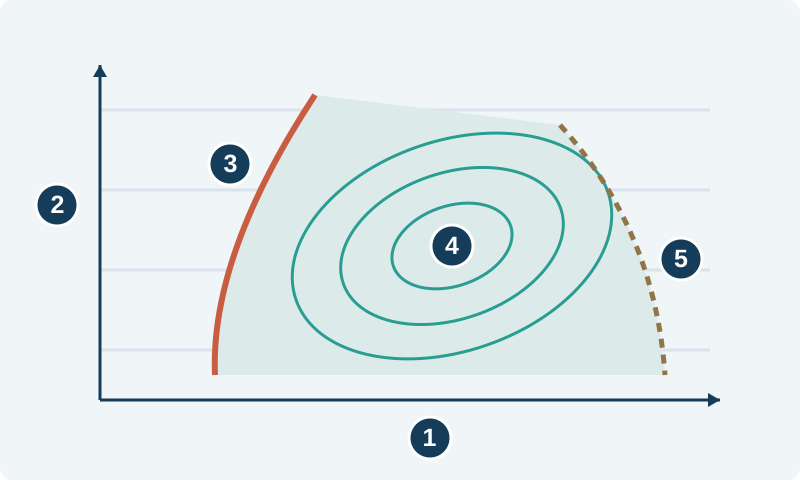
Horizontal axis: corrected air mass flow.
Vertical axis: absolute pressure ratio.
Low-flow boundary: surge limit.
Contours: efficiency islands inside the operating map.
High-flow boundary: choke region.
Qualitative schematic, not measured test data or operating limits.
Worked Example: Estimate Pressure Ratio and Airflow
Consider a hypothetical four-stroke gasoline engine. These are assumed teaching values, not specifications for any vehicle or recommended boost settings:
- Engine displacement: 2.0 liters.
- Engine speed: 6,000 rpm.
- Volumetric efficiency: 90%, referenced to intake manifold conditions.
- Target manifold boost: 100 kPa gauge, approximately 14.5 psi.
- Local atmospheric pressure: 100 kPa absolute.
- Intake restriction: 5 kPa.
- Compressor-to-manifold pressure loss: 10 kPa.
- Compressor inlet temperature: 300 K, approximately 80°F.
- Intake manifold air temperature: 323 K, approximately 122°F.
- Hypothetical map reference conditions: 100 kPa absolute and 300 K.
The separate inlet and manifold temperatures matter. Airflow into the cylinders depends on manifold air density; the map correction uses conditions entering the compressor.
Step 1: How to Calculate Turbocharger Pressure Ratio
Manifold absolute pressure is:
100 kPa atmospheric + 100 kPa boost = 200 kPa
Required compressor outlet pressure is:
200 + 10 = 210 kPa absolute
Compressor inlet pressure is:
100 − 5 = 95 kPa absolute
Therefore:
Pressure ratio = 210 ÷ 95 ≈ 2.21
Using manifold pressure divided by atmospheric pressure would give 2.00, understating the compressor’s pressure requirement.
Step 2: Estimate Cylinder Volume Flow
A four-stroke engine completes an intake cycle every two crankshaft revolutions. With the assumed volumetric efficiency:
Volume flow = 0.002 m³ × (6,000 ÷ 2) × 0.90
That gives 5.4 m³/min, or 0.090 m³/s, referenced to manifold conditions.
Volumetric efficiency is an estimate of cylinder filling. Use credible engine data when available, and check how its VE values are defined before inserting them into a calculation.
Step 3: Convert Volume Flow to Mass Flow
Using the ideal-gas approximation for air, density is pressure divided by the product of air’s specific gas constant and absolute temperature.
At the assumed manifold conditions:
Air density ≈ 200,000 ÷ (287 × 323) ≈ 2.16 kg/m³
Then:
Actual mass flow ≈ 0.090 × 2.16 ≈ 0.194 kg/s
That is approximately 25.7 lb/min.
This estimate assumes negligible charge leakage and no EGR contribution. More complex engine arrangements require additional accounting.
Step 4: Correct the Flow for the Map
The inlet and reference temperatures are both 300 K, so the temperature correction is 1. The pressure correction is:
Corrected flow ≈ 0.194 ÷ (95 ÷ 100) ≈ 0.204 kg/s
That is approximately 27.0 lb/min.
The point to plot on this hypothetical map is therefore:
27.0 lb/min corrected airflow at a pressure ratio of 2.21.
On a real map with different reference conditions, recalculate the corrected flow.
Plot Several Engine Speeds
Repeat the calculation using realistic boost, temperature and VE assumptions at several engine speeds. Do not automatically assume maximum boost is available everywhere.
For illustration, retain the previous temperatures and pressure losses while changing rpm, VE and boost:
| Engine speed | Assumed VE | Assumed manifold boost | Pressure ratio | Corrected airflow |
|---|---|---|---|---|
| 2,500 rpm | 85% | 50 kPa gauge | 1.68 | 8.0 lb/min |
| 4,000 rpm | 90% | 100 kPa gauge | 2.21 | 18.0 lb/min |
| 6,000 rpm | 90% | 100 kPa gauge | 2.21 | 27.0 lb/min |
Holding pressure losses constant simplifies this example. Actual intake and intercooler losses change with flow, and manifold temperature and VE also vary.
Mark these points on the candidate map and connect them as an approximate operating path. Check:
- Is the low-rpm point comfortably clear of surge?
- Do frequently used operating points pass through useful efficiency areas?
- Does maximum-rpm demand approach choke or a speed limit?
- Would hotter weather or higher elevation move a point into a problem area?
Without the actual turbo compressor map, these numbers cannot establish whether a turbo fits. They describe demand, not guaranteed performance.
The compressor map also cannot prove the turbine will provide enough power to reach the low-rpm target. Turbine sizing and wastegate or VGT boost control need separate consideration.
Common Mistakes That Change the Answer
Ignoring altitude. Lower atmospheric pressure reduces compressor inlet pressure. Maintaining a specified manifold absolute pressure therefore requires a higher pressure ratio. If your target is gauge boost instead, recalculate manifold absolute pressure too.
Ignoring intake restriction. A restrictive filter or undersized inlet reduces pressure at the compressor. Use inlet conditions under load rather than assuming atmospheric pressure reaches the wheel.
Ignoring intercooler pressure drop. Manifold boost is downstream of the compressor. The compressor must provide the additional pressure consumed by the charge-air system.
Using the wrong temperature. Compressor inlet temperature belongs in the correction. Manifold temperature belongs in the cylinder-density calculation.
Mixing units or map definitions. Keep kg/s separate from lb/min, absolute pressure separate from gauge pressure, and corrected flow separate from actual flow. Do not assume a CFM figure represents the same reference conditions.
Why an OE Replacement Should Stay Matched
For a stock engine, preserve the intended turbo specification or use a verified equivalent. A turbocharger compressor map for stock replacement covers only part of the assembly’s behavior.
Turbine geometry, housings, actuator calibration, oil and coolant connections, and engine controls all affect compatibility. A larger compressor may place some operating points in a favorable island while creating problems elsewhere.
Identify the unit using how to find your turbocharger part number. If considering a core replacement, review CHRA versus complete turbocharger replacement. A core must match the surrounding assembly; wheel diameter alone is insufficient.
Common Questions
Is pressure ratio the same as boost?
No. Boost is usually gauge pressure measured relative to local atmospheric pressure. Compressor pressure ratio divides absolute compressor outlet pressure by absolute inlet pressure, accounting for restrictions and pressure losses.
Why do compressor maps use corrected airflow?
Corrected airflow expresses operating conditions relative to specified reference inlet pressure and temperature. It lets you compare your calculated airflow with the map’s test data. Always use the reference conditions and correction method supplied with that map.
Does the highest efficiency island identify the best turbo?
Not by itself. Your engine needs a useful operating path across several speeds and loads, with adequate surge and speed margins. Turbine matching, response, boost control and installation compatibility also affect the choice.
Can a compressor map tell me when full boost will arrive?
No. It shows compressor behavior, but boost response also depends on exhaust energy, turbine sizing, rotating inertia, engine operation and boost control. A plotted low-speed point represents a requirement, not proof that the turbo can reach it.
Can I use a map from a similar-sized compressor wheel?
Only as a rough comparison. Wheel blade design, trim, housing geometry and other details affect performance. For a selection decision, obtain a map for the actual compressor configuration.
Do I need a turbo compressor map for a stock replacement?
Usually, correct OE matching is the priority. Confirm the turbo part number, engine application, housing connections and actuator compatibility. A map becomes more useful when engine airflow requirements or the turbo configuration change.
Why does turbocharger airflow stop increasing?
Turbocharger airflow can level off when the compressor approaches its choke region. Local passages can reach sonic conditions, so increasing turbo speed adds little useful flow while efficiency and pressure capability decline. Check whether your engine’s operating point at maximum rpm approaches choke or a published speed limit.
Need help identifying a replacement? Contact LeadTurbo with your turbo part number, vehicle details, modifications and symptoms.